
You know your applications and infrastructure. What you need is unified visibility from the network edge to the line of code.
Most engineering teams don’t struggle to understand their architecture; they struggle with alert noise, tool sprawl, and endless collector maintenance. Observability should deliver clarity, not consume your team’s day.
Conducive provides the specialized engineering expertise to implement, correlate, and manage your Splunk Observability Suite, ITSI, AppDynamics, and ThousandEyes deployments. We handle the operational heavy lifting so your team can focus on slashing MTTR and driving uptime.

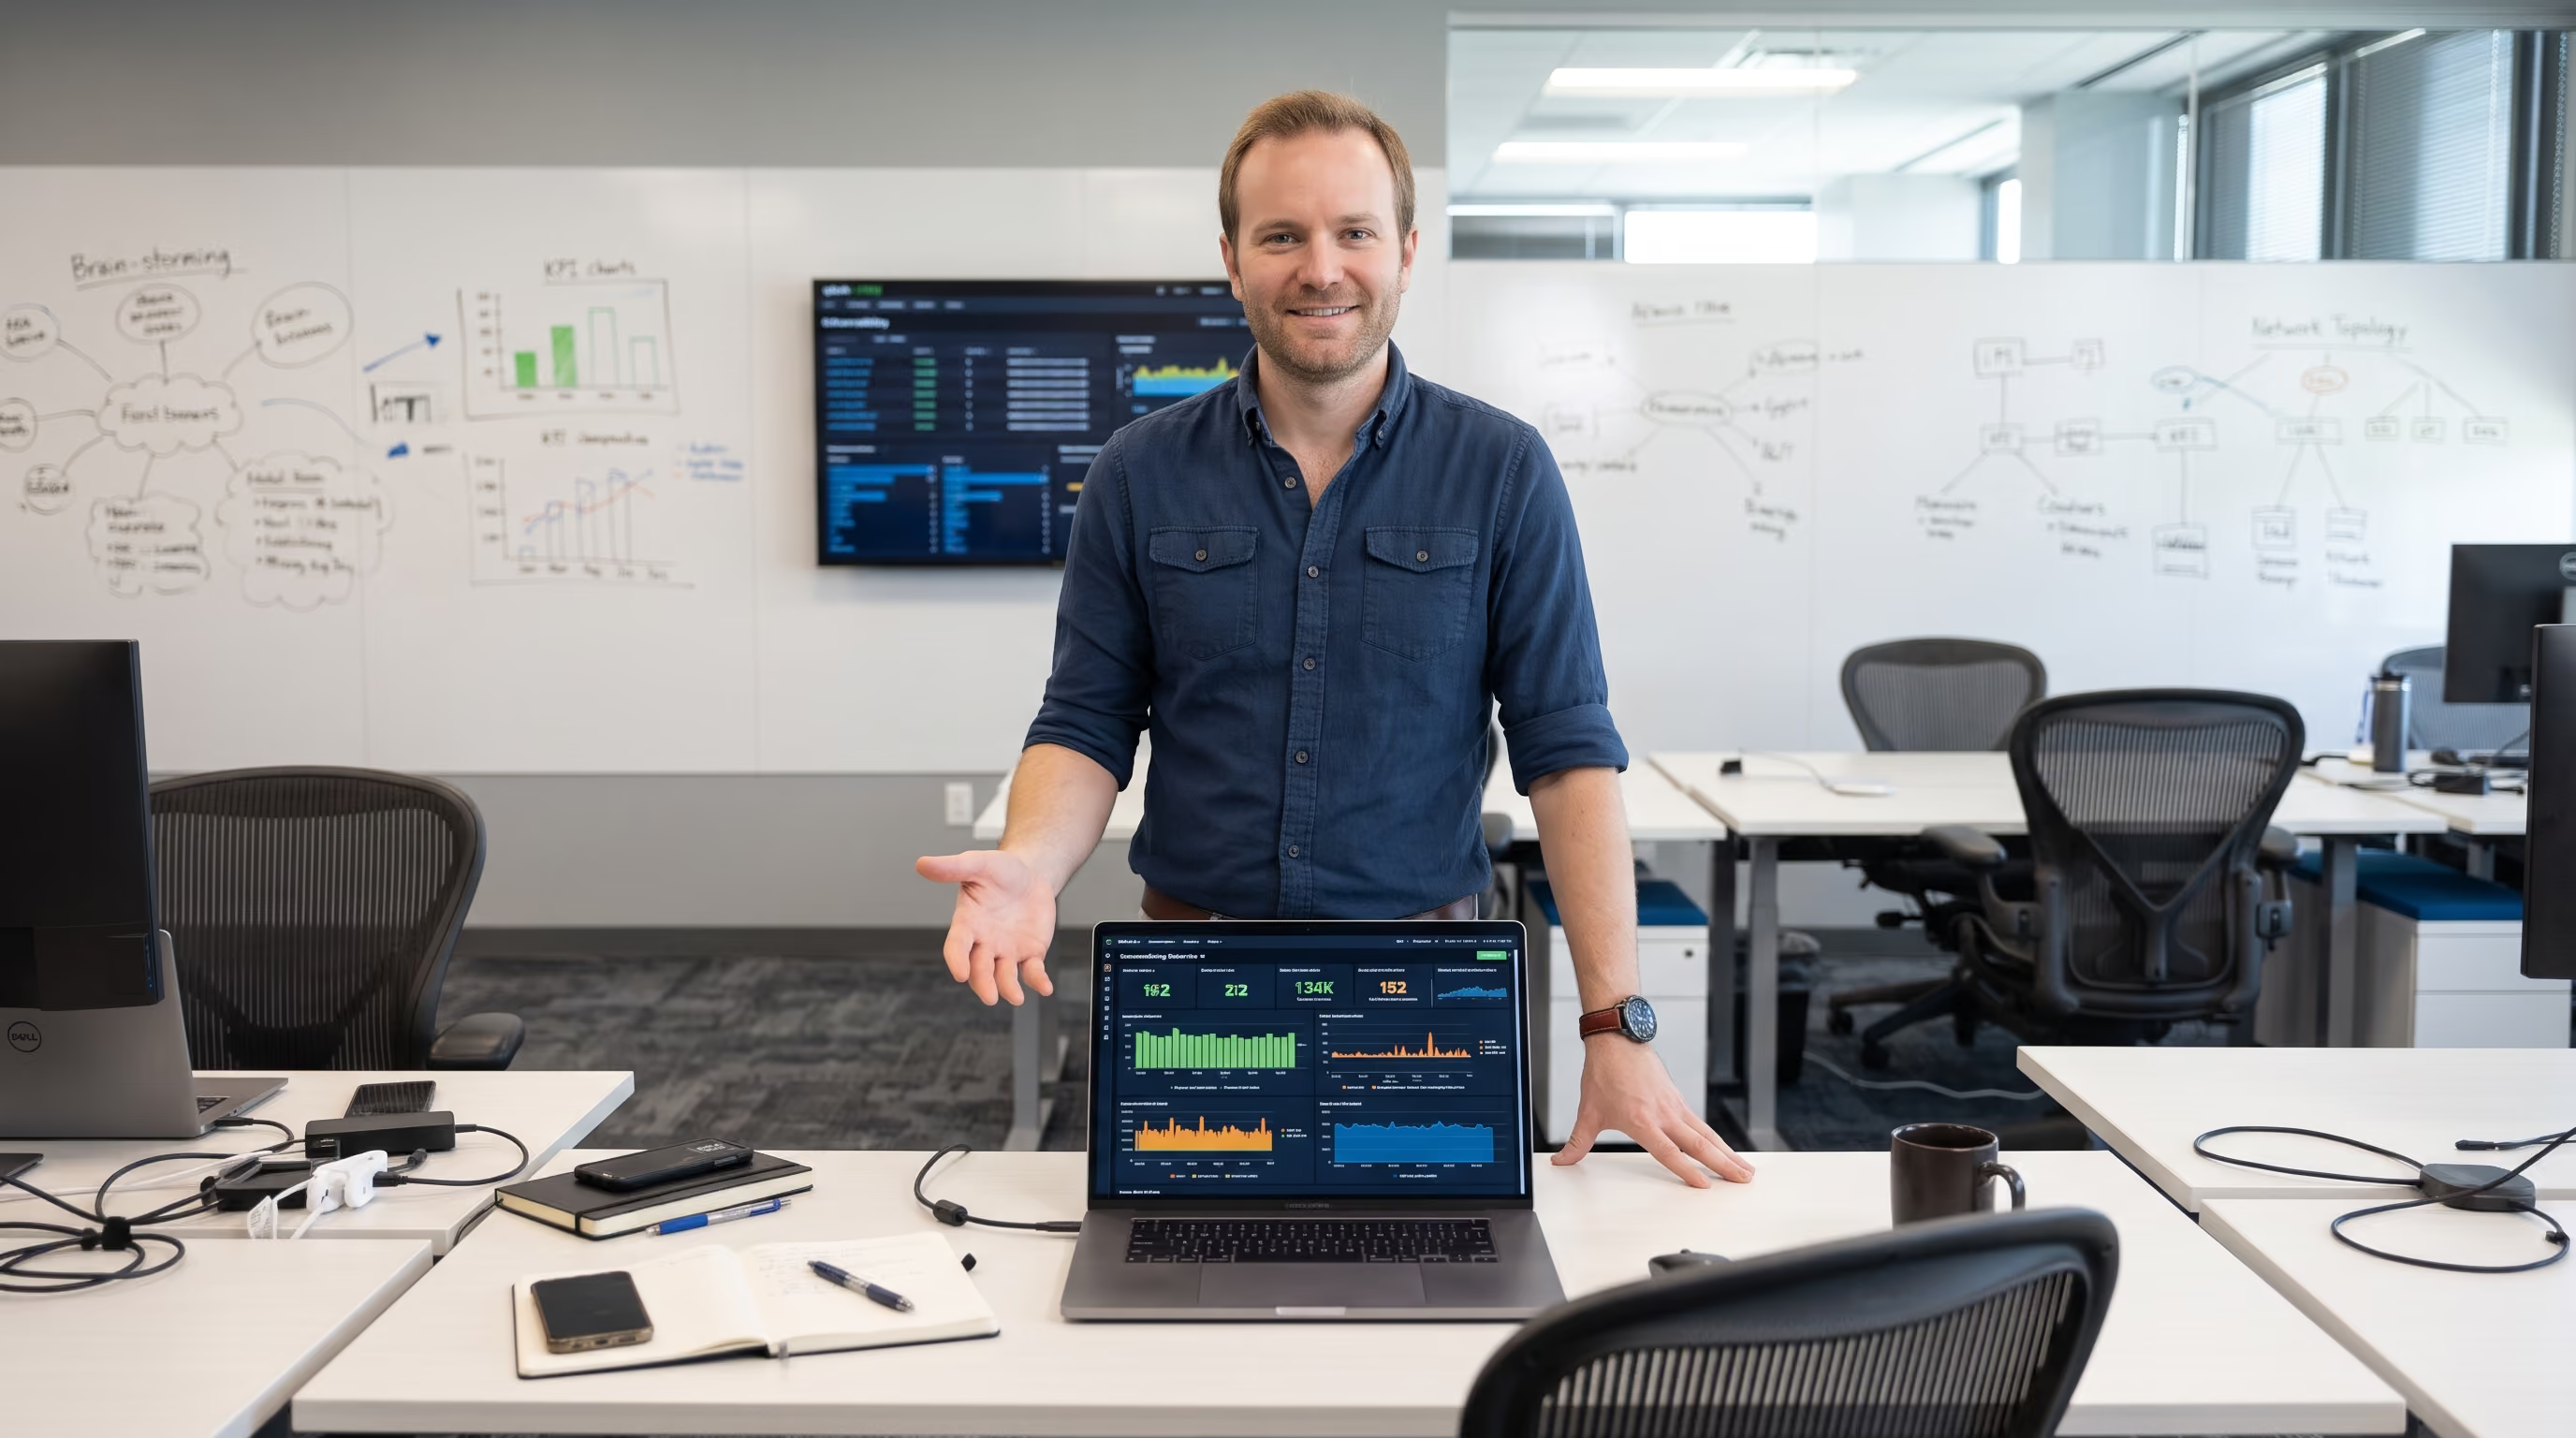
Our approach is simple: We eliminate blind spots and alert fatigue, so you can focus on business outcomes.
You invested in tools like Splunk, AppDynamics, and ThousandEyes to solve complex problems, not to spend hours babysitting collectors and dashboards. By offloading administration to Conducive, your team is free to focus on root-cause analysis and actual performance insights.
Beyond day-to-day operations, we act as your strategic advisors to mature your observability architecture. Whether unifying network telemetry with ITSI or standardizing on OpenTelemetry, we ensure your platforms work together to maximize operational ROI.
Complete platform administration so your team focuses on performance, not infrastructure.
Fast troubleshooting, custom synthetic tests, and quick fixes to unblock your busy teams.
Strategic platform deployments and OpenTelemetry migrations with defined, guaranteed deliverables.
Correlated event analytics, ITSI service topologies, and intelligent alerting to eliminate operational noise.
Since 2011, we specialize in building scalable, resilient monitoring platforms across the Splunk and Cisco ecosystems. Here is a sample of what we deliver for your team:

We’ve compiled answers to the most common questions clients ask about our business strategy consulting.
Rather than treating them as isolated silos, we engineer an interconnected observability pipeline. ThousandEyes provides complete path visibility across the WAN, internet, and cloud networks; AppDynamics and Splunk APM provide deep code-level tracing and service maps; and Splunk ITSI serves as the centralized "Manager of Managers," ingesting health states from each platform to correlate dependencies and display executive service health on unified Glass Tables.
Absolutely. We help engineering teams transition away from legacy, vendor-proprietary agents to open-source OpenTelemetry standards. We design, deploy, and maintain OTel Collectors across your clusters, standardizing your trace, metric, and log collection pipelines so your data flows seamlessly into Splunk Observability Suite without runtime drag.
We act as an operational force multiplier. We take on the time-intensive tasks—collector upgrades, custom instrumentation, dashboard building, synthetic script maintenance, and threshold tuning—giving your internal DevOps and SRE teams the actionable insights they need without saddling them with the platform administration.
Yes. We offer targeted Observability Health Checks and Maturity Assessments. Our senior engineers review your existing monitoring footprint, identify blind spots and redundant tools, pinpoint optimization opportunities to lower ingest costs, and deliver a phased technical roadmap customized to your environment.
Join the 250+ clients who trust Conducive Consulting to operate and optimize their observability environments. Reach out to us today to get a better understanding of our engagement process and discover how seamlessly we can integrate with your team.
